Levenshulme and Burnage Property News
M19 sees 9.77% increase in property price in 2017!
Now the Christmas decorations are down and kids are back at school we can look at how the property market performed in 2017 in M19.
For many the market was busy and concerns raised in the press about the effect of Brexit on the market seemed unfounded locally. This is not a surprise as new build property or even space to build it are distinctly lacking within the area!
There was a total of 684 new properties coming to the market in the whole of 2017. August was the busiest month of the year for new instructions when 68 became available to buy. Surprisingly though, this is 8.5% less than 2016 when 747 new properties came to the market.
It is therefore no shock to see that the total number of properties sold within the M19 postcode fell from 484 in 2016 to 403 in 2017 as there was less available to buy. What is interesting though is that the percentage of properties sold compared to available stock decreased from 64.7% in 2016 to 58.9% in 2017. The type of property where there was an increase in sales in 2017 compared to 2016 was detached properties, but the numbers are small compared to the overall total. 9 were sold in 2017 compared to 6 in 2016.
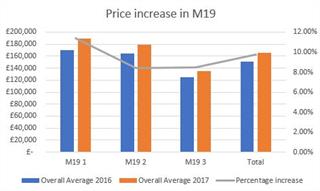
The most important thing for the majority of buyers and owners within the M19 postcode is usually the amount the property price has increased over the two years. This can also be narrowed down further when you compare the sold prices over the whole year by looking at the postcode sectors of M19 1, M19 2 and M19 3.
| 2016 | Detached | Semi | Terraced | Flat/Mais | Overall Average |
| M19 1 | £ 122,000 | £ 184,156 | £ 166,497 | £ 134,227 | £ 170,365 |
| M19 2 | £ 168,000 | £ 203,681 | £ 142,037 | £ 81,066 | £ 164,722 |
| M19 3 | £ 112,750 | £ 151,286 | £ 117,269 | £ 91,362 | £ 124,592 |
| Total | £ 141,917 | £ 185,309 | £ 128,968 | £ 107,407 | £ 150,416 |
| 2017 | Detached | Semi | Terraced | Flat/Mais | Overall Average |
| M19 1 | £ - | £ 199,080 | £ 163,832 | £ 136,667 | £ 189,765 |
| M19 2 | £ 232,750 | £ 223,036 | £ 153,331 | £ 84,597 | £ 178,647 |
| M19 3 | £ 165,090 | £ 160,798 | £ 131,093 | £ 114,577 | £ 135,179 |
| Total | £ 195,161 | £ 204,686 | £ 141,746 | £ 99,762 | £ 165,114 |
M19 1 outperformed M19 2 and M19 3 with an increase of 11.39% compared to 8.5% which is certainly a good sign. We have seen a noticeable difference in the type of buyers within the area and a shift from investors to first time buyers. 
On the rental side there were 2367 listings on Rightmove for properties to let within Levenshulme and Burnage. Whilst this figure does seem high it is worth noting that some properties to let are marketed by more than one agent. 1193 properties were let out in 2017 in M19 which was very similar to the previous year.
It was noticeable that rental prices were not as buoyant in 2017 and the increases seen in 2016 were not repeated and rents remained static.
About The Blog
This Blog looks at what is happening in Manchester, the property market, events and community news along with investment ideas and tips for those loosing to invest in the area.
Tom Simper - Editor
Manchester is one of the fastest growing markets in the country. If you need any assistance buying, selling or letting properties in the area we have over 30 years of experience and local knowledge to help.
T: 0161 441 0563
E: [email protected]


Leave a comment