Blog Post
How Did Brexit Affect the Liverpool Property Market in 2018 – and its Future for 2019?

A few weeks ago, I suggested property values in Liverpool would be between 1.2% and 2.1% different by the end of the year. It might surprise some people that Brexit hasn’t had the effect on the Liverpool property market that most feared at the start of 2018.
The basis of this point of view can clearly be seen in the number of property transactions (i.e. the number of property sold) that have taken place locally since 2008. The most recent property recession was the Credit Crunch years of 2008/2009/2010.
In property recessions, the headline most people look at is the average value of property. Yet, as most people that sell also go on to buy, for most home movers, if your property has gone down in value, the one you want to buy has also gone down in value so you are no better or worse off. If you are moving up market - which most people do when they move home - in a repressed market, the gap between what yours is worth and what you will buy gets lower ... meaning you will be better off.
Yet, most property commentators, including myself, suggest (and I have mentioned this before in some of my other blog articles) a better measure of the health of the property market is the transaction numbers (i.e. the number of people selling and buying). So, I decided to look at the 2018 statistics, and compare them with the Credit Crunch years (2008 to 2010) and the boom years (2014 to 2017). The results can be seen in the table below.
| The Average Number of Properties Sold Per Month Over the Last 10 Years in Liverpool | |||
|
| 2008 to 2010 | 2014 to 2017 | 2018 |
| Jan | 296 | 446 | 471 |
| Feb | 335 | 432 | 506 |
| March | 387 | 598 | 716 |
| April | 322 | 402 | 492 |
| May | 376 | 519 | 528 |
| June | 355 | 553 | 712 |
| July | 404 | 526 | 506 |
| Aug | 348 | 561 | 571 |
| Sept | 324 | 611 | 459 |
| Oct | 335 | 534 | 472 |
| Nov | 267 | 555 | 593 |
| Dec | 313 | 601 | 542 |
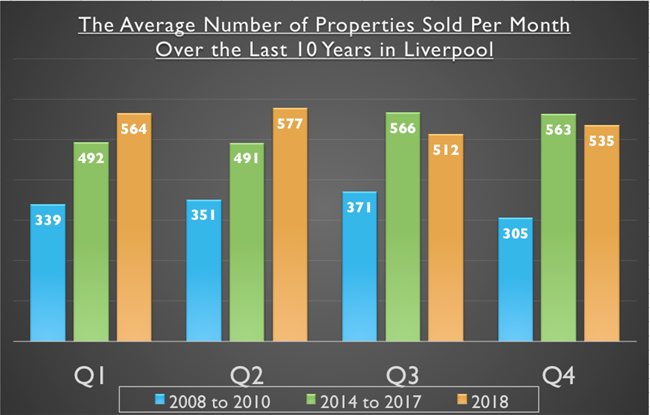
Then, I looked at the average quarterly figures for those chosen date ranges ... and created this graph … 
In that 2008 to 2010 property Credit Crunch recession, the average number of properties sold in the Liverpool area were 339 per month. Interesting when we compare that to the boom years of 2014 to 2017, when an average of 528 properties changed hands monthly … yet in the ‘supposed’ doom laden year of 2018, an impressive average of 547 properties changed hands monthly … meaning 2018 compared to the boom years of 2014 to 2017 saw a drop of 3.6% - yet still 61.7% higher than the Credit Crunch years of 2008 to 2010.
The simple fact is, the fundamental problems of the Liverpool property market are that there haven’t been enough new homes being built since the 1980’s (and I don’t say that lightly with all the new homes sites dotted around the locality). Also, the cost of buying your first home remaining relatively high compared to wages and to add insult to injury, all those issues are armor-plated by the tougher mortgage rules which were introduced in 2014 and the current mortgage market conditions.
It is these issues which will ultimately determine and form the rather unexciting, yet still vital, long term outlook for the Liverpool (and national) housing market, as I feel the Brexit issue over the last few years has been the ‘current passing diversion’ for us to worry about. Assuming something can be sorted with Brexit, in the long term property values in Liverpool will be constrained by earnings increases with long term house price rises of no more than 2.5% to 4% a year.
Fundamentally, the question I am asked by many Liverpool buy to let landlords and Liverpool homebuyers is ... “should I wait to buy or not?”
As a Liverpool homebuyer, one shouldn’t be thinking of what is happening in Westminster, Brussels, Irish Backstop, China or Trump and more of your own personal circumstances. Do you want to move to get your child in ‘that’ school or do you need an extra bedroom for your third child? For lots of people, the response is a resounding yes - and in fact, I feel many people have held back, so once we know what is finally happening with Brexit and the future of it, there could a be a release of that pent-up demand to move home as people humbly just want to get on with their lives.
There is little to be lost in postponing a house purchase until there is better clarity on the situation. If it isn’t Brexit it will something else - so just get on with your lives and start living. We got through the global financial crisis/Credit Crunch in ‘08/’09, Black Wednesday in ’92 where mortgage interest rates went from 8.5% to 15% in one day, we got through the worst stock market crash with Black Monday in ’87, hyperinflation, power shortages, petrol quadrupling in price in less than a year and a 3 day week in the ‘70’s … need I go on?
Liverpool Landlords? Well, where else are you going to invest your money? Like I said earlier in the article, we aren’t building enough homes to keep up with demand... so as demand outstrips supply, house values will continue to grow. Putting the money in the building society will only get you 1% to 2% if you are lucky. In the short term though, there could be some bargains to be had from shortsighted panicking sellers and in the long term ... well, the same reasons I gave to homeowners also apply to you.
Find out more about our Sales Service here!

 Gillian Bell
Mar 11, 2019, 11:00 AM
Leave a comment