Blog Post
Top 25 Most Saleable Streets in Liverpool
Following on from my last article, if you recall I said that Waterloo Road had the most properties sold in the L3 Liverpool postcode, yet I felt that this information wasn’t telling the whole story, as some roads in Liverpool have more properties on them than others. Therefore, I promised that I would compare the average number of properties sold by the actual number of properties on that street, to find out the streets whose owners proportionally moved (or sold) more often than the rest of the locality.
To give some foundation to the article, in 2017 Liverpool homeowners had, on average, lived at their existing address for 17 years and 6 months. However, when I looked at the difference between homeowners with and without a mortgage; Liverpool homeowners without a mortgage had lived in their Liverpool home for an average of 23 years and 9 months compared with 10 years and 1 month for homeowners with a mortgage. Interestingly, Liverpool’s Council house tenants have on average resided at their present home for 11 years and 4 months, whilst finally for those who rent from a private landlord, tenants generally have lived in their property for an average of 3 years and 11 months (up from 3 years 5 months only five years ago).
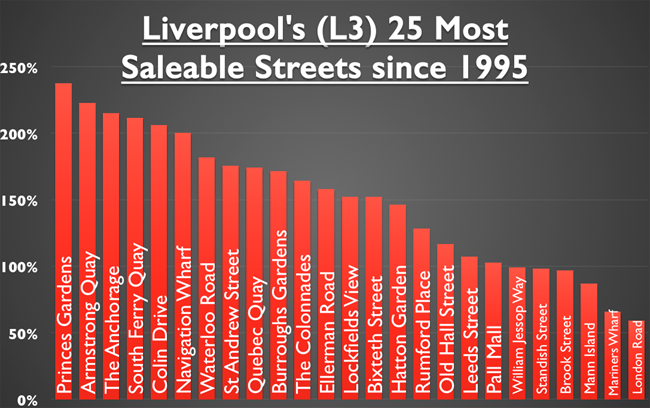
The L3 street in the top 25 saleable streets with the highest number of households on it is London Road, which has 521 residential addresses. Yet since 1995, only 306 properties have changed hands (some multiple times!) .. which means the street’s saleability or churn rate is 58.7%.
However, the street or road that has the highest saleability or churn rate is Princes Gardens … which has 96 households on it, yet since 1995 there have been 228 house sales … a saleability rate of 237.5%. Here is the full breakdown of the top 25 streets …
|
Street (in L3) |
The Street's Saleability (or Churn) Rate since 1995 |
|
Princes Gardens |
237.5% |
|
Armstrong Quay |
222.6% |
|
The Anchorage |
214.9% |
|
South Ferry Quay |
211.1% |
|
Colin Drive |
206.0% |
|
Navigation Wharf |
200.0% |
|
Waterloo Road |
181.5% |
|
St Andrew Street |
175.3% |
|
Quebec Quay |
173.8% |
|
Burroughs Gardens |
171.1% |
|
The Colonnades |
164.1% |
|
Ellerman Road |
157.5% |
|
Lockfields View |
151.8% |
|
Bixteth Street |
151.7% |
|
Hatton Garden |
146.2% |
|
Rumford Place |
128.0% |
|
Old Hall Street |
116.5% |
|
Leeds Street |
106.9% |
|
Pall Mall |
102.5% |
|
William Jessop Way |
98.8% |
|
Standish Street |
97.7% |
|
Brook Street |
96.7% |
|
Mann Island |
86.5% |
|
Mariners Wharf |
65.5% |
|
London Road |
58.7% |

So, as you can see, some interesting statistics and a lot
more correlation between saleability rate and property values (unlike the
article last time where we compared value to ‘out and out’ raw sales figures).
Therefore, what does this all mean to Liverpool homeowners and Liverpool landlords? Well these 25 streets are the best performing streets out of the 213 streets in the Liverpool (L3) area so if you live/own a property on those 25 streets … you are sitting on a very saleable street. If you want to find out how saleable your street is .. please drop me a line and we can discuss this further.

Leave a comment