Blog Post
Unemployment - the Secret Driver of the Liverpool Property Market?

If you have been reading
my articles on the Liverpool property market recently, you will see that in the
three years since the referendum of the ‘B’ word (that word is banned in our
household), we have proved beyond doubt that it (whose name shall remain
nameless) has had no effect on the Liverpool property market (or the UK as a
whole).
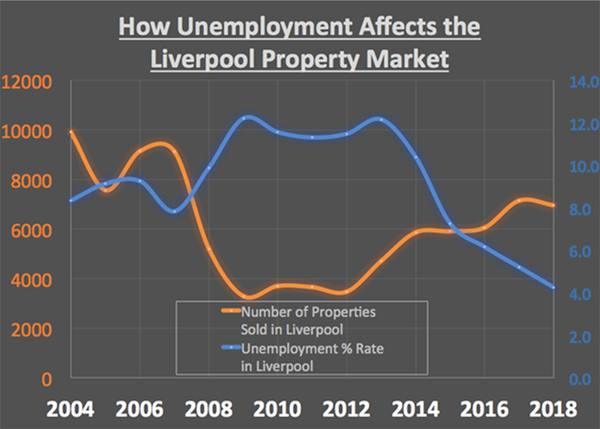
So one might ask, what does affect the property market locally? Well many things on the demand side include wages, job security, interest rates, availability of mortgages, confidence in the economy, inflation, speculative demand ... the list goes on. Yet as my blog readers will note, I like to delve deeper into the numbers and I have found an interesting correlation between unemployment and the number of properties sold (i.e. transactions).
Why transaction levels and not house prices? Well just looking at Liverpool house prices as a bellwether has flaws. Many property market commentators and economists believe transaction numbers (the number of properties sold) give a more accurate and candid indicator of the health of the property market than just house values alone. The reason is twofold. First most people when they sell also buy, so if property values have dropped by 10% or risen by 10% on the one you are selling, it would have done the same on the one you are buying - meaning to judge the health of a property market is very one dimensional. Secondly, the act of moving is very much a human thing. Property habitually conveys a robust emotional connection with homeowners - a connection that few would attribute to their other investments like their savings or stock market investments. Moving home could be described as a human enterprise, moving from one chapter of one’s life to another. When people move home, it shows they are moving forward in their lives and so this gives a great indicator of the health of the property market.
Looking at Liverpool’s on
the graph, you can see an inverse relationship between unemployment and housing
transaction levels.
Property transactions in Liverpool dropped by 63.96%, whilst unemployment in Liverpool rose by 55.91% during the 2007 to 2009 Global Financial Crash
There is clearly a relationship between conditions in the Liverpool job market and the number of people who move home ... interesting don’t you think?
| Year | Unemployment % Rate | Number of Properties Sold in Liverpool |
| 2004 | 8.3 | 9907 |
| 2005 | 9.1 | 7562 |
| 2006 | 9.2 | 9132 |
| 2007 | 7.8 | 9122 |
| 2008 | 9.9 | 5201 |
| 2009 | 12.2 | 3288 |
| 2010 | 11.5 | 3697 |
| 2011 | 11.3 | 3649 |
| 2012 | 11.5 | 3469 |
| 2013 | 12.2 | 4709 |
| 2014 | 10.4 | 5855 |
| 2015 | 7.3 | 5905 |
| 2016 | 6.1 | 6054 |
| 2017 | 5.2 | 7139 |
| 2018 | 4.3 | 6953 |
Now I am not saying unemployment is the only factor influencing the Liverpool property - but it has to be said there is a link.
As a country (and indeed here in Liverpool) over the last 40 years, we have seen a shift in the outlook over the purpose of housing and the development of the religion of following house prices (and I appreciate the irony of me writing these articles on Liverpool - feeding that habit!) Yet, when did owning a home turn from buying a roof over your head to an out and out investment vehicle? I do wish people would stop fretting about their intrinsic value being associated with their Liverpool home. Now of course, I am not dismissing the current levels of Liverpool house prices - we just have to take into consideration other metrics alongside them when judging the health of the property market locally.
One final thought, looking on a broader scale in the UK, those towns and cities whose property markets bounced back after the Global Financial Crash had high levels of employment and low unemployment whilst places with high unemployment and relatively low employment have, on the other hand, typically underperformed.
So the next time you are considering a house move or buying a buy to let property in Liverpool ... don’t make your judgement on house price growth alone.

 Gillian Bell
May 28, 2019, 14:45 PM
Leave a comment